1. Cases and Research
Topic: The Nature in Place
Where: Southampton
Target: Birds (seagulls)
Nowadays, in an era of big data, almost all the phenomena people see can be explained by data. For interaction design, user behavior can also be summarized by data. Below are some maps and cases made up of data that I investigated.
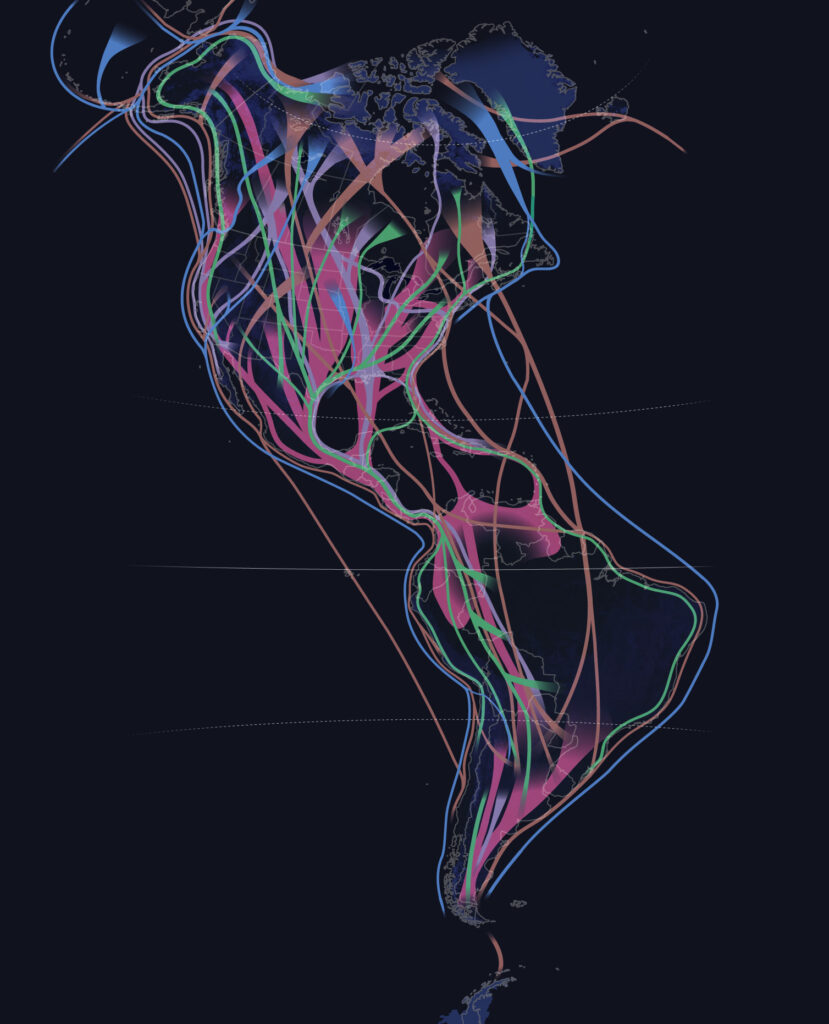
The lines of different colors in No.1 Middle School represent different kinds of birds, which bring people a very strong visual effect. I think the inspiration for my works is to highlight the direction and route of bird migration in a simple way, giving people an intuitive experience.
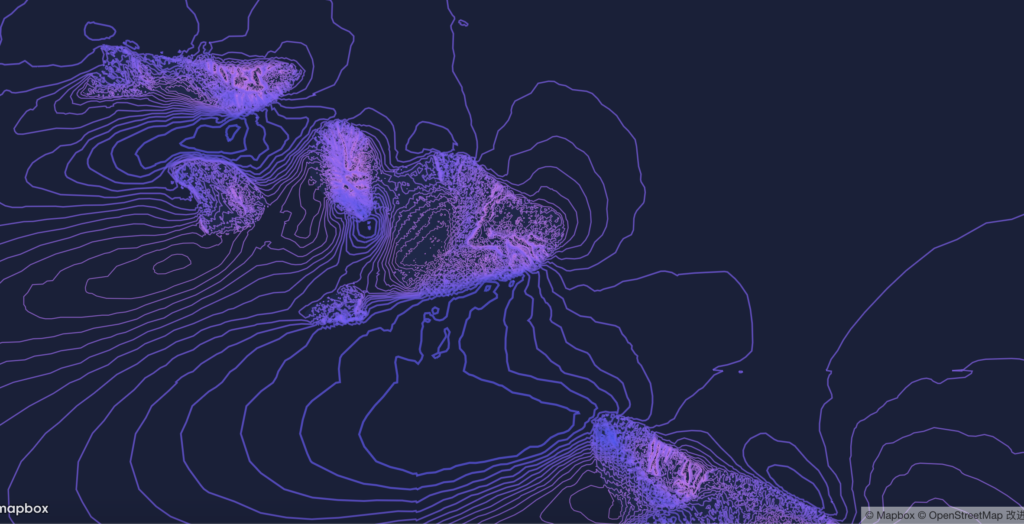
The method of collecting data by mapbox is one of the effective data collection methods. Similar software can use GPS system to track data movement, record routes and quantities. Fig. 2 is a dynamic data graph for collecting the index and change of shoulder width of fixed population.

My chosen software platform for collecting data is Mapbox, which has the advantage of connecting links on mobile phones for data statistics. In the link of the mobile phone, I can change the name of each label to determine the items I want to collect. Mapbox is very powerful. I found a data case made by Mapbox, as shown in Figure 3. This map is a data investigation on the wind direction, which is one of the elements of global climate change. The complete display of this map should be a moving map, which will also show the wind speed and direction to users.
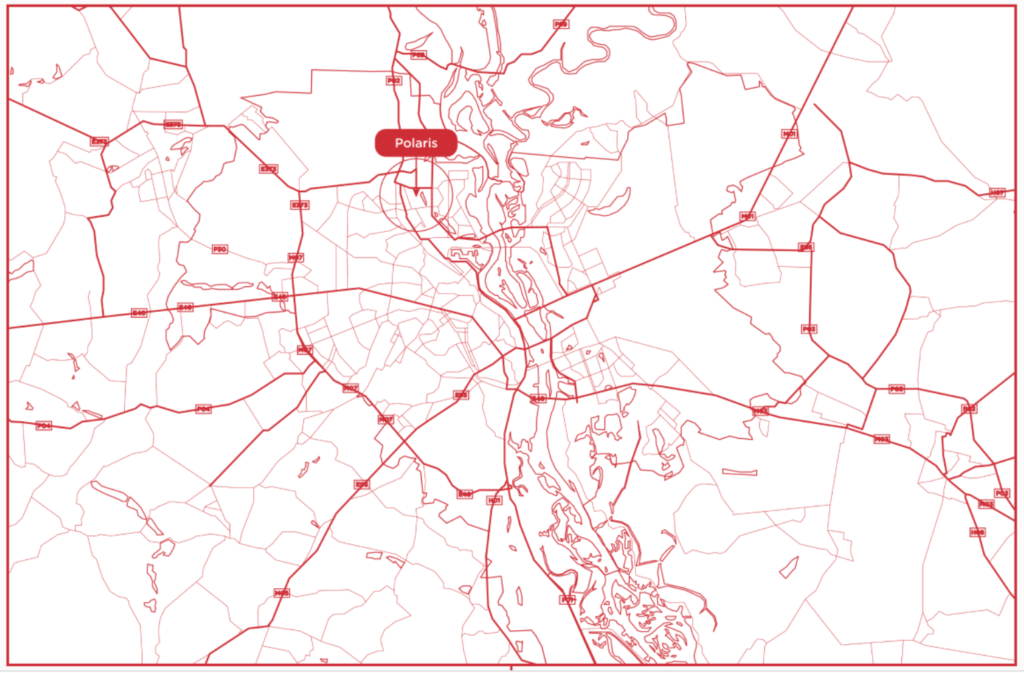
In addition, I also made research on visual visualization. For example, how to make users enjoy visually on the basis of intuition. Figure 4 is a good map case. The whole map is composed of red and white, and the color is not very messy. It makes people feel relaxed and simple after reading it, which is also my favorite style.
2. Ideas and Brainstorm
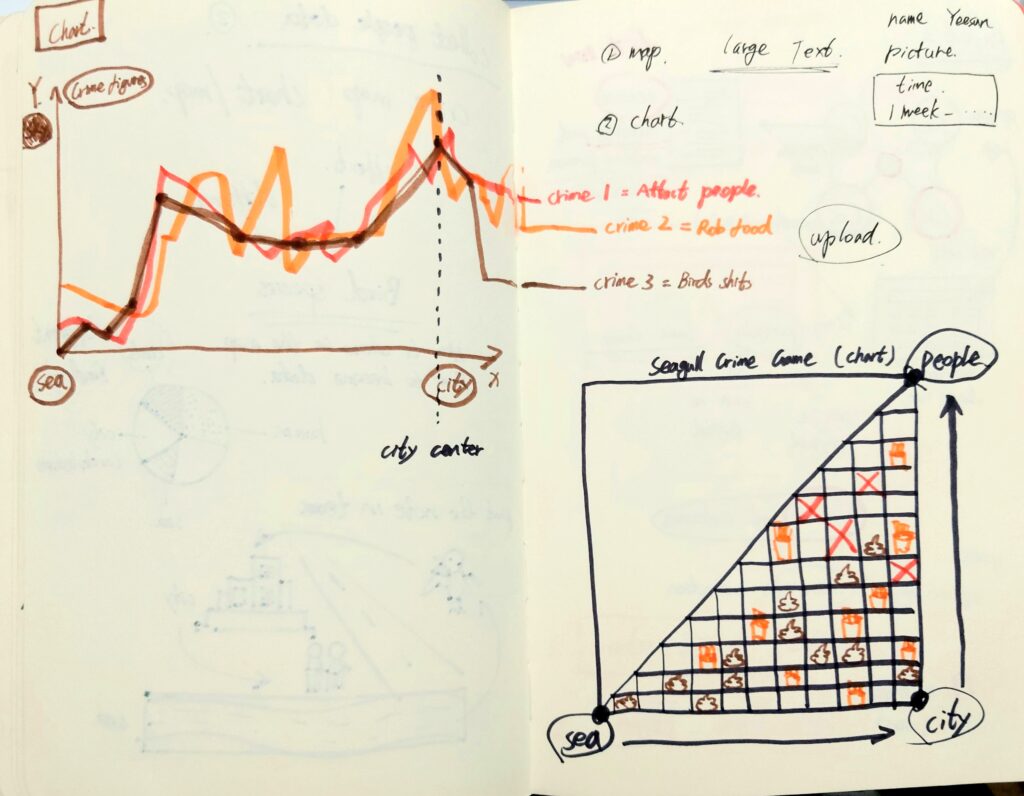
My idea is to collect the data of “crime” of seagulls existing in Southampton, and finally make a visual data map. I am interested in seagulls, but at the same time I love and hate them. They are lovely, but they often shit in cities, rob people of food, and even take the initiative to attack people for food. I have done some research on seagulls. Seagulls are rare and protected animals now, but they always commit crimes in cities because human beings pollute the ocean and prey on fish and shrimp excessively. The industrialization of cities makes seagulls homeless. In addition, some people in cities are willing to feed them, so they depend on cities and begin to live in urban circles gradually. Therefore, in my opinion, this is actually the seagull’s “crime” caused by human beings destroying the balance of ecological environment, which is the message I want to convey to users.
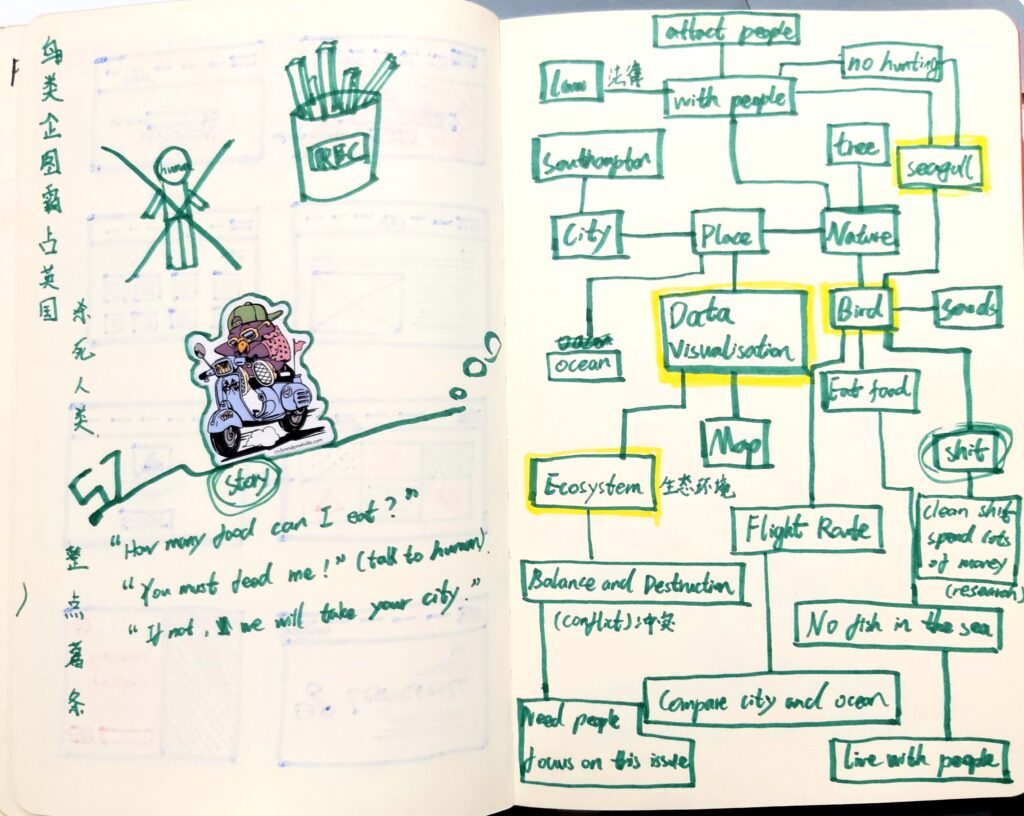
The second way of expressing my ideas is to give a visual idea in the form of a graph. The picture below is a sketch of my idea.
3. Design Process
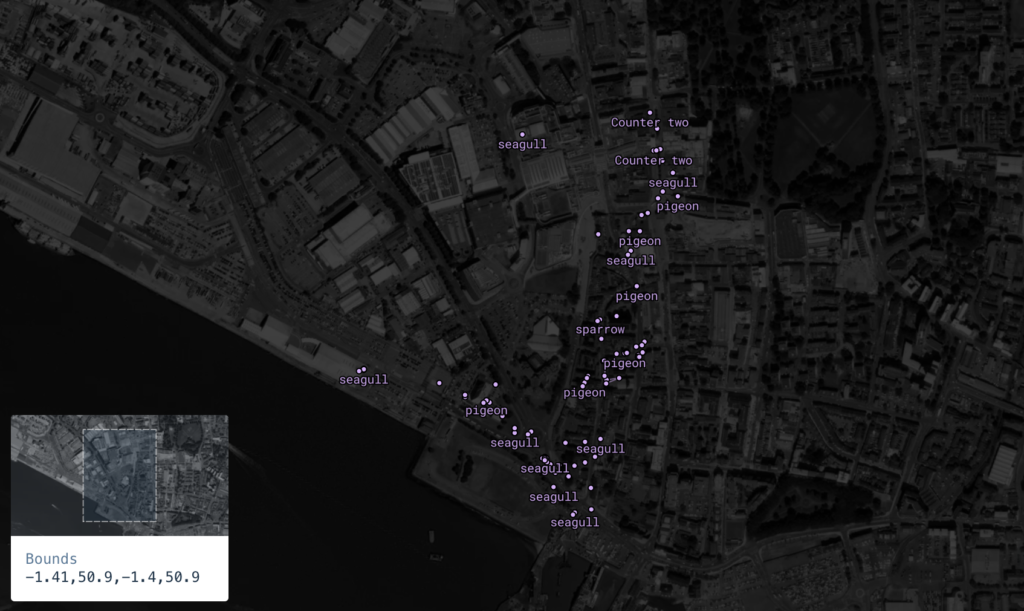
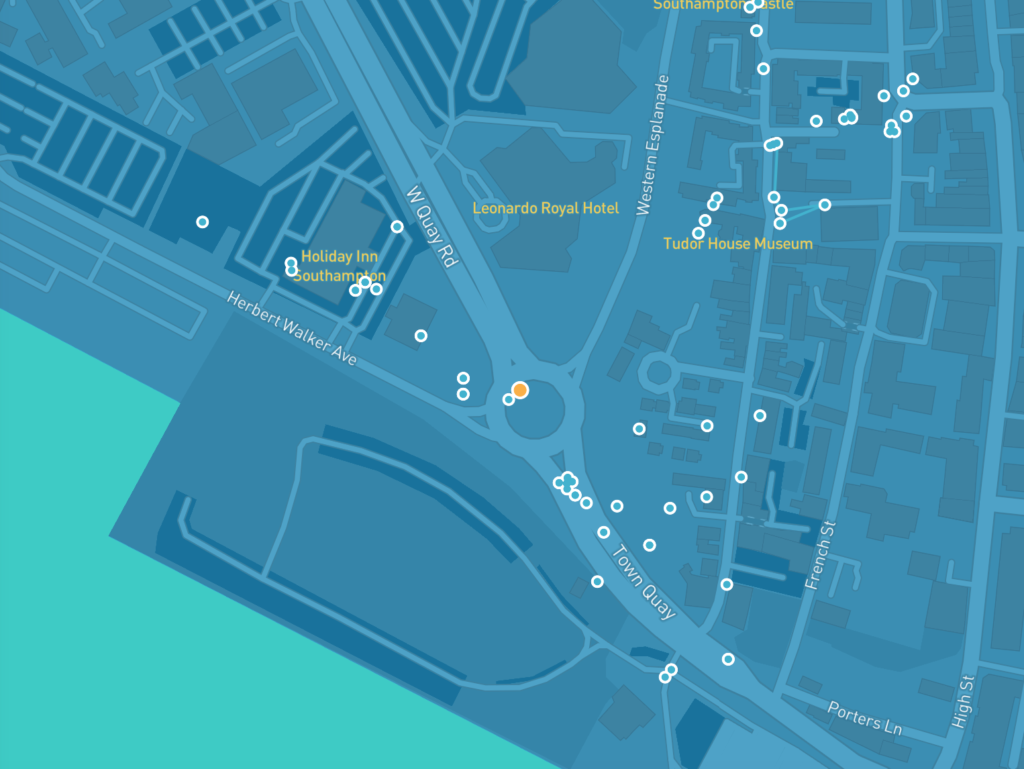
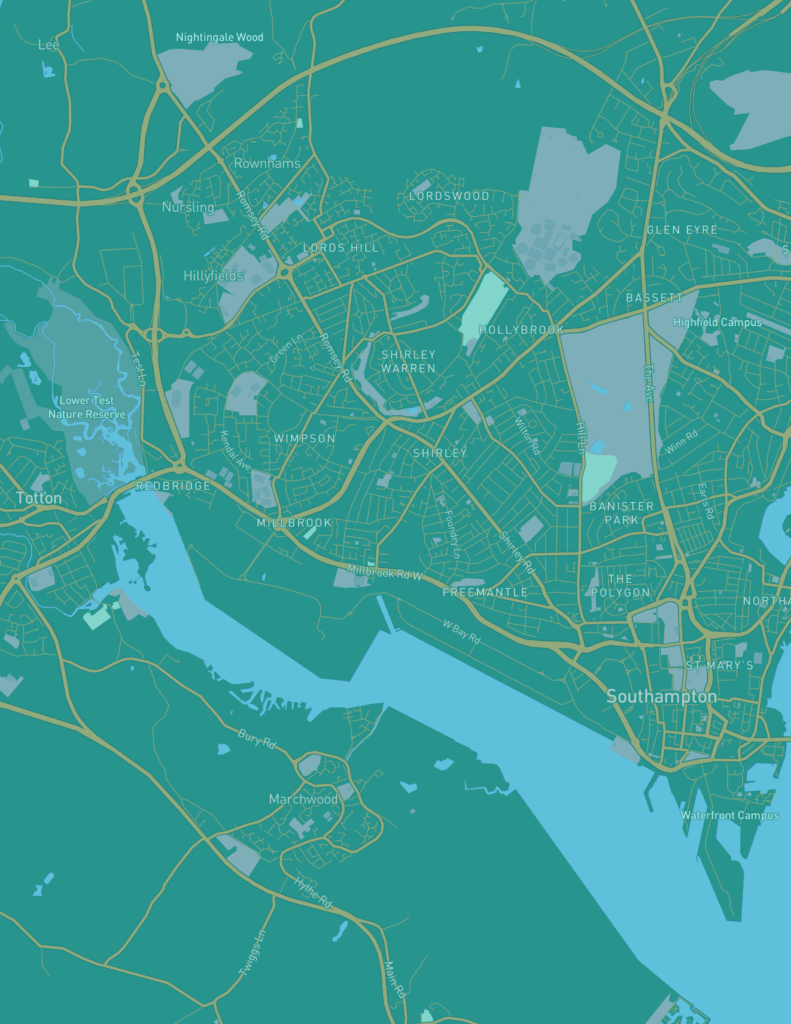
I used mapbox to collect data of seagull’s “crime” in Southampton. First, I observed the main flight path of seagulls during my three days away, and the scope was mainly determined from the city center to the seaside. Fig. 7 is the general range of bird distribution in Southampton, which I first counted with mapbox tool.

4. Outcomes
The picture above shows the process of making a map. The following are the final exhibition works (2 pieces).
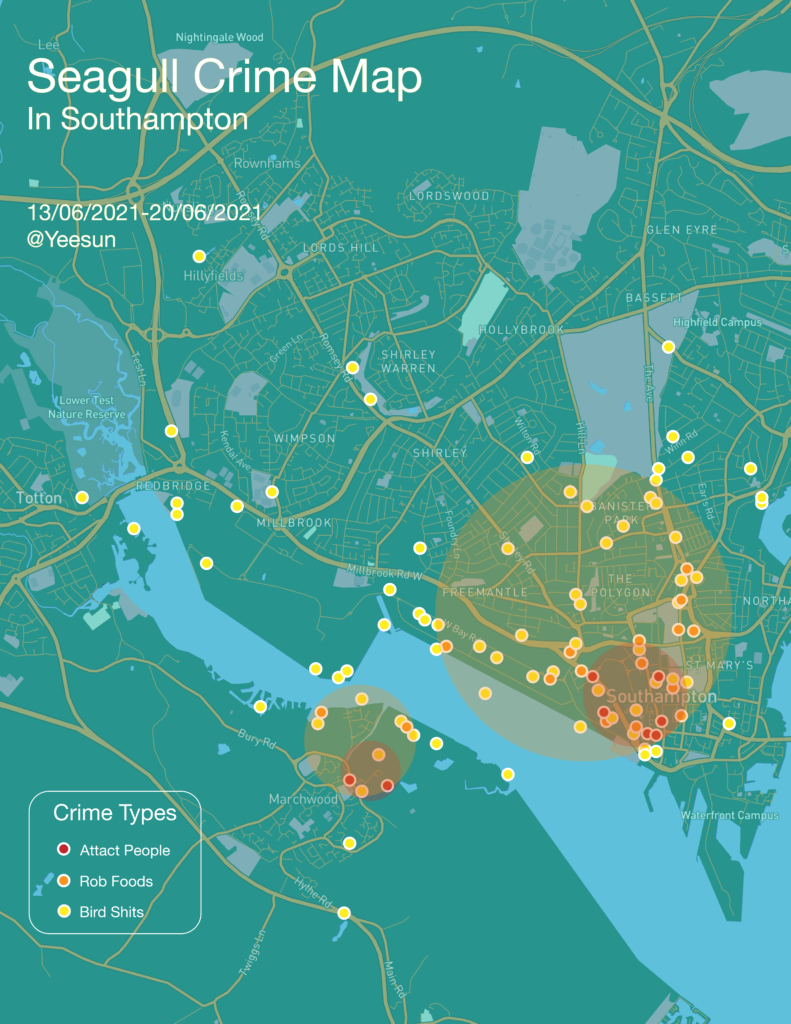
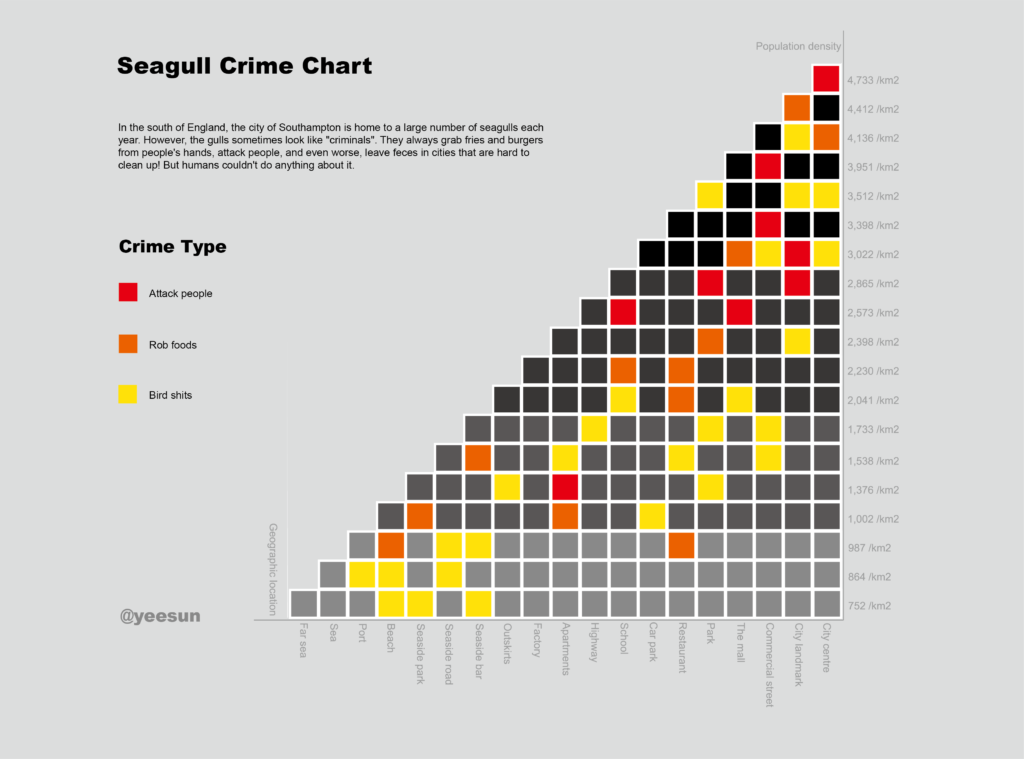
The purpose of my two works is to convey to users that seagull’s “crime” is closely related to human activities. The destruction and imbalance of ecological environment will lead animals to enter the human life circle, and through maps and tables, we can see that the city center and commercial street are the places where seagulls frequently commit crimes, which shows that human food and a large number of human gatherings will make seagulls aggressive. The topic I chose in this topic is to make people reflect on their behavior, protect the ecological environment in time, return to naturalness and avoid over-industrialization.
